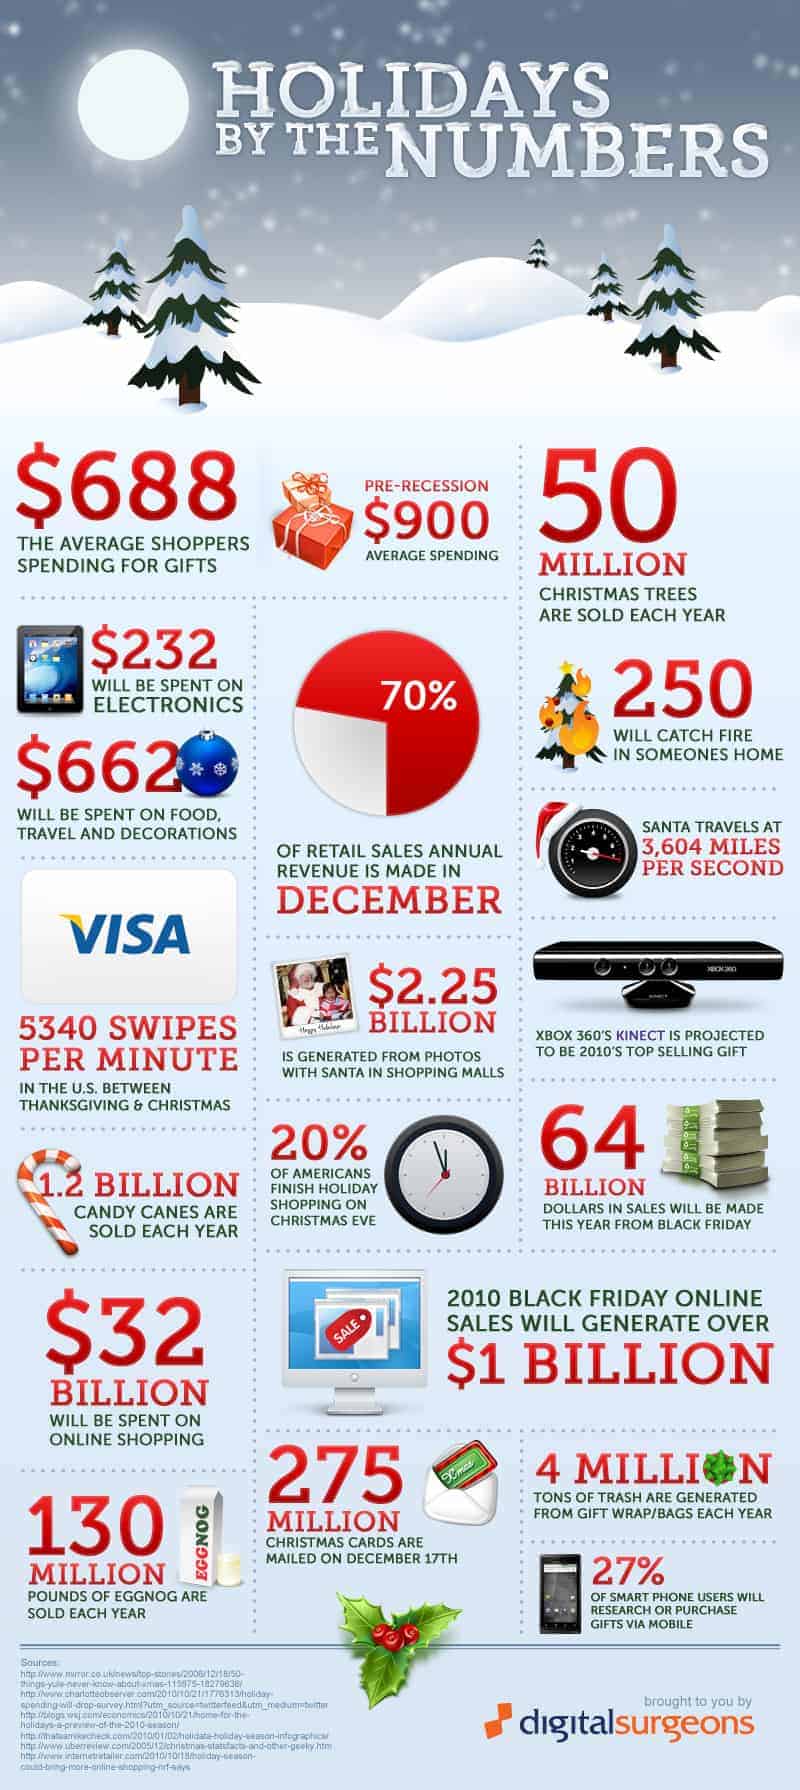

With the status of the economy still in question, there is more pressure than ever on holiday shoppers. Prior to the recession the average holiday shopper spent $900 on gifts, today an average of $688 is being spent. Just because our pocket books are lighter does not mean the holidays stop coming. Without a doubt my favorite months are November through February.
More than the gifts, it’s the spirit of the holidays that I like best, beginning in November with Thanksgiving, a time to eat non-stop. Followed by Winter Holidays, a time when houses are covered with Christmas lights. No matter your religion, Christmas lights are always a joy to look at. Not only is this a time for the holidays, but with them comes a change in weather. Being from a place where it feels like Summer all the time, the Winter time is sweet relief from the heat. A time when you can cuddle with your significant other and drink your favorite hot chocolate on the couch while watching a movie.
Something I do every year around this time is watch National Lampoon’s Christmas Vacation. This movie ranks among my top favorites, if you have not seen this movie, I highly recommend it. If you are a fan of Chevy Chase, or any of the old National Lampoon movies, you will definitely like this movie. On another note, according to this infographic this time of year is when retailers make the most money, in fact up to 70% of annual sales are made during this time. [via]