Infographics have been a huge part of my life for many years now. Obviously plenty you you guys seem to eat these graphics up as well. Why though? Why are we so attracted to data visualizations?
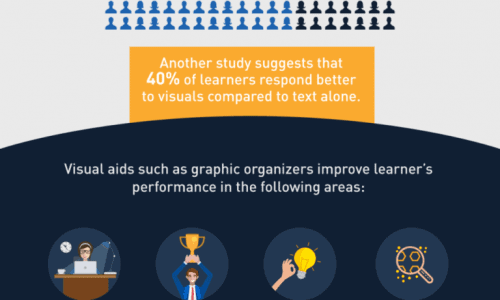
Today’s graphic is here to answer that question. First off, our brains are very visual. Consuming data using a visual representation is much faster than reading. It only takes 1/10th of a second to understand a visual scene. Gaining knowledge seems to be fast and easy when using infographics. That’s why our motto at Daily Infographic is to “Learn something new everyday”.
We’re not just here to provide you infographics, but the information they provide. To broaden your mind and pique your interest. With data visualization use growing hundreds of times across all information mediums.
142% increase in newspapers, 400% in literature, and 9900% on the internet. During college when my textbook provided a visual aid I was able to comprehend the idea much easier. Not to mention data viz online has lead to wonderful organizations and companies who provide extraordinary data to the public.
I’ve recently joined a group to help tell the change in my town, Austin over the years. Whether it is traffic, health violations, cost of living, or the growth of the upper class. Being able to use hard facts to create a tool to help other is the point of data viz.